
Live and matured products covered by the StructrPro tool have posted positive returns, with nearly 90% of maturing products making a profit, delivering 6.6% p.a. on average.
In a previous article we looked at the importance of performance of the underlyings for structured products and how structured product returns compare to different scenarios for the underlying assets themselves.
Structured products are defined return investments with a profile that is often referred to as non- linear
In this analysis piece we look at a range of products in the US market covered by the StructrPro tool.
Structured products are defined return investments with a profile that is often referred to as non- linear. This means that the product performance cannot simply be reduced to an equity, bond and cash portfolio. Structured products typically have various protection features and target growth or income from underlyings that perform as required, generally showing growth or avoiding losses.
Statistics from the whole US market show that both live and matured products covered by the service have posted healthy returns, with nearly 90% of the 53,000 matured products making a profit. Average returns across all products stand at 6.6% per annum. The average dollar payoff from a 100 USD investment is 111.56 USD, compared to the underlyings themselves with an average of 109.68 USD, both over an average term and time in the market of 1.6 years.
We can therefore see that not only have the vast majority of products returned more than capital and the then prevailing risk-free rate, but that they have also in general had the edge over the underlyings themselves.
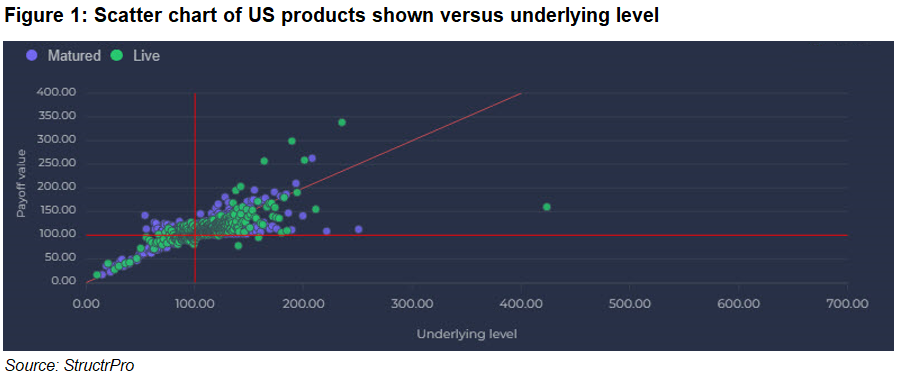
Figure 1 shows the performance of US products (live products represented in green and matured in purple). The underlying performance is given on the x-axis and the payoff of the structured product on the y-axis.
The red vertical and horizontal lines are set at 100 represent the initial level of the underlying and product notional. There is a cluster of dots representing individual product payoff in the upper right quadrant, indicating positive growth in both the underlying and structured product. By studying the diagonal red line, we can see that there are plenty of instances where the structured product pays more than the underlying and vice versa. While far few products have lost money it can be observed that there hardly any products which have performed below the underlying in the downside case. This is because of the typical protection features present - many structured products have shown return of capital even when the underlying has significantly declined.
Within the US market the benchmark index of the S&P 500 is by far the most common underlying asset used for structured products. Figure 2 shows the underlying versus product performance for products linked solely to the S&P 500 which have now matured.
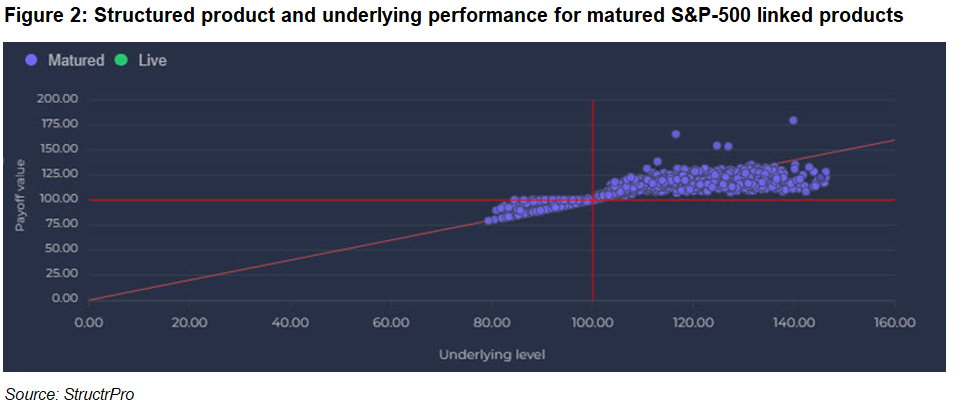
A similar picture can be seen for S&P 500 products except that when the underlying and product have both shown a positive return the underlying has tended to outperform the structured product somewhat. This is partly due to the very strong index performance and also to the typical payoff profile such as the presence of a cap.
CUSIP 13605WM57 was a Market Linked Securities - S&P 500 Note issued by Wells Fargo in 2020. It had a defensive buffer of the first 15% of losses and featured 1.25x return up to a cap of 117.5% total payoff. Although classed as a Leveraged return product, the relatively modest participation and low cap means that the maximum annualised return is only 4.7%. This was significantly above the risk-free rate at the time of issuance. In the event the S&P 500 grew by 46% which meant the index showed a gain much better than the structured product. The investor base for which this was intended should have been reasonably happy with the return given the product’s risk profile.
Another Leveraged return product example linked to the S&P 500 was Capped Return Enhanced Notes - S&P 500 (CUSIP 48133MZC7) issued by J.P. Morgan. It had 3x leverage but up to a maximum 20.05% return in a 13-month investment, representing 18.8% annualised. With full downside this is a rather different risk profile, heavily betting on some modest growth to get the product to its cap level. In the event the S&P 500 grew by 11% so that the product easily reached the cap and performed twice as strongly as the underlying itself.
An interesting single stock in the US market in recent years has been Nvidia. There are nearly 1000 US structured products linked to Nvidia covered on StructrPro. The products have shown a very good return of 8.5% annualised, but product return has in general underperformed the underlying which has shown very strong growth, up three-fold in the last year and a scarcely believable 33 times in five years. This is illustrated by the fact that with an average product length of just over half a year the average product USD payoff is at 107 USD with the underlying having performed at 128 USD.
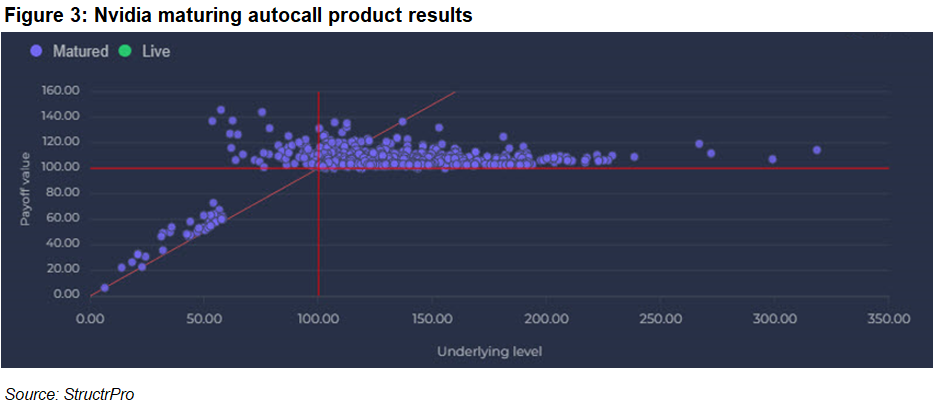
The final figure shows the results of Growth and Income Auto-calls linked to Nvidia that have matured. Given the nature of the product we see consistent product payoffs above the red line, although the underlying performance is quite spread out across the x-axis depending on the timing of the product.
Structured products, especially yield enhancement payoffs cannot expect to keep pace with very strong underlying growth since this is not their risk profile or market expectation. These products would have shown the same return even in flat or in some cases slightly falling markets.
The question of comparing underlying and product performance is an interesting one but highly nuanced. It is important that distributors and investors remember the product aims and profile and do not simply compare raw returns since there will be many different possible types of outcomes. Structured products should be judged on the long term and majority performance for the risk profile and appropriate benchmarks.
Image: Kasto/Adobe Stock.