In the second part of our Europe market analysis, we look at the product type mix and the payoffs which have driven activity in the third quarter of 2024.
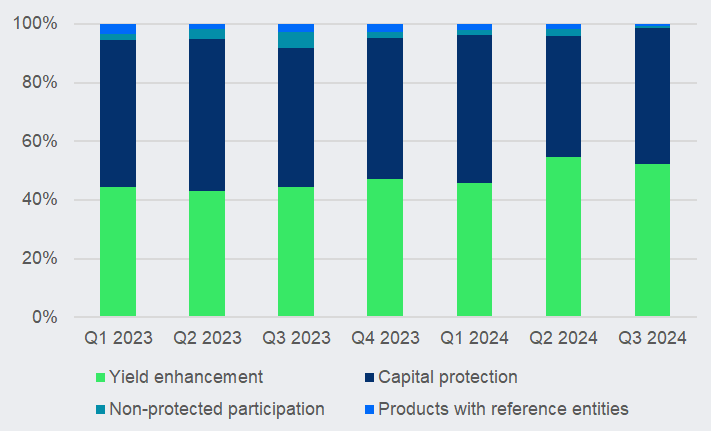
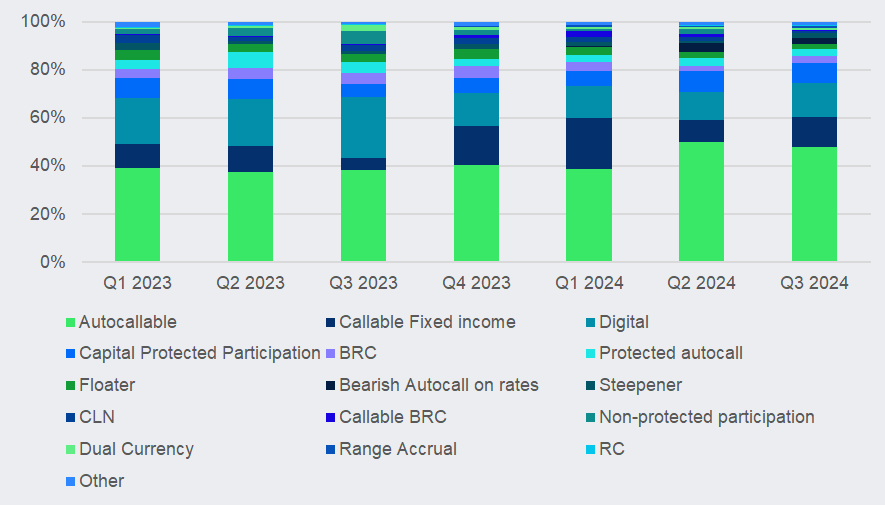
Our analysis shows that yield enhancement products have dominated the market, driven by Switzerland’s preference for income-generating products. In Q3 2024, yield enhancement products reached their highest market share (69%), showing consistent growth from the 54% seen in Q1.
Products with capital protection, while significant, declined steadily: from 40% in Q1 2023 to 29% in Q3 2024. Participation products and products with reference entities (credit-linked notes or CLNs) both account for minimal parts of the market, with their shares shrinking to 1% by Q3 2024. This suggests a clear shift toward yield enhancement products.
Europe: product types – market share by sales volumes

Source: SRP
The rapidly growing Swiss market has played a pivotal role in shaping the overall European market by reducing the dominance of capital protection and increasing the importance of yield enhancement this year.
When excluding Switzerland’s significant impact (see chart below), the market share of capital protection products (minimum capital return >=90% of the initial invested capital) is significantly bigger, highlighting the rest of Europe’s more risk-averse approach to structured products.
Across Europe, the shares of participation products and CLNs remain consistently minor throughout the period.
Europe (ex-Switzerland): product types – market share by sales volume
Source: SRP
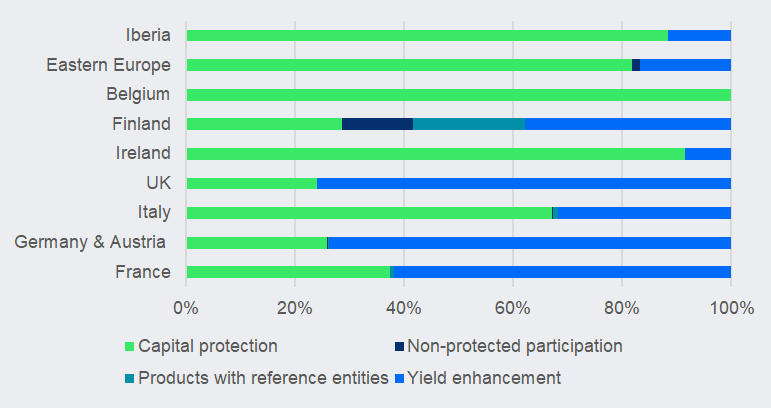
The market mix across the offer jurisdictions reveals distinct preferences. In Q3 2024, yield enhancement products dominated in markets like Germany & Austria (74%), the UK (76%), and France (62%), while capital protection was dominant in Ireland (91%), Belgium (100%), Eastern Europe (82%) and Iberia (88%).
Italy demonstrates a strong preference for capital protection (67%) but also significant yield enhancement activity (32%). Finland shows the most diverse mix, with notable shares in yield enhancement (38%), capital protection (29%) and CLNs (21%) alongside some non-protected participation (13%).
Europe: product categories - market map Q3 2024
Source: SRP
The chart below looks at the quarterly dynamics of the payoffs in Europe, excluding Switzerland.
Europe (ex-Switzerland): payoffs – market share by sales volumes
Source: SRP
In Q3 2024, autocallables captured a 48% market share with an estimated generated sales of US$14 billion. This represents a slight decline from 50% in Q2 2024 but an increase from 38.5% in Q3 2023. Year-on-year (YoY) growth was modest at 0.7%, rising from US$13.9 billion in Q3 2023. However, quarter-on-quarter (QoQ) sales saw a significant decline of 18.4% compared to Q2 2024, reflecting a drop in momentum.
The callable fixed rate notes experienced a strong performance in Q3 2024, achieving estimated sales of US$3.7 billion and a market share of 12.6%. The market share increased from 9.0% in Q2 2024 and 4.7% in Q3 2023. Thus, the sales volumes showed a YoY growth of 118%, up from US$1.7 billion in Q3 2023. QoQ growth was also robust at 19.6%, climbing from US$3.1 billion in Q2 2024, reflecting sustained demand.
Digital payoffs accounted for an estimated sales volumes of US$4.1 billion in Q3 2024, holding a 14% market share. While this was an improvement from 11.7% in Q2 2024, it marked a significant decline from 25.5% in Q3 2023. YoY growth plunged by 55.4%, down from US$9.2 billion in Q3 2023. On a QoQ basis, sales rose slightly by 2.7%, from US$4 billion in Q2 2024.
Products offering participation in the performance of the underlying and capital protected in terms of a minimum capital return at or above 90% achieved estimated sales of US$2.4 billion in Q3 2024, reflecting an 8.0% market share. This was a decline from 8.7% in Q2 2024, but an improvement YoY compared to 5.4% in Q3 2023. Sales saw a YoY growth of 21.1%, rising from US$1.9 billion in Q3 2023, but QoQ sales fell by 20.6% from US3 billion in Q2 2024, reflecting weakening quarterly performance.
Barrier reverse convertibles (BRCs) with fixed maturity recorded sales of US$952m in Q3 2024, securing a 3.3% market share. This represents a slight increase from 2.3% in Q2 2024. Sales grew by 23% QoQ from US$774m in Q2 2024 but dropped by 44.2% YoY from US$1.7 billion in Q3 2023.
Floating rate notes captured a 2.2% market share during Q3 2024, a decline from 2.6% in Q2 2024 and 3.4% in Q3 2023. YoY growth fell by 49%, from US$1.2 billion in Q3 2023, while QoQ sales dropped by 29.2%, from US$896m in Q2 2024.
As relatively new payoff, bearish autocalls on interest rates contributed US$790m in sales for Q3 2024, achieving a 2.7% market share.
Steepeners achieved a market share of 2.0% in Q3 2024, up from 0.8% in Q2 2024 but slightly lower YoY from 1.1% in Q3 2023. Sales grew by 48.1% YoY from US$403m in Q3 2023 and by 131.4% QoQ from US$258m in Q2 2024.
Range accrual payoffs achieved a 0.7% market share, up from 0.2% in Q2 2024 and 0.1% in Q3 2023. YoY growth surged by 503%, from Q3 2023, while QoQ sales increased significantly by 163.8%.
Sales for CLNs totaled US$242m in Q3 2024, translating to a 0.8% market share. This was a decrease from 1.8% in Q2 2024 and 2.7% in Q3 2023. YoY sales plummeted by 75.2% from US$975m in Q3 2023, while QoQ sales fell by 60.1% from US$606m in Q2 2024, indicating steep declines.
The chart below looks at the quarterly dynamics of the payoffs in Switzerland.
Switzerland: payoffs – market share by sales volume

Source: SRP
In Q3 2024, autocallables in Switzerland generated estimated sales of US$12.9 billion, accounting for 62.4% of total sales. This represents a decrease in market share from 59% in Q2 2024 but an increase from 50% in Q3 2023. Sales volumes also declined 23.3% QoQ from US$16.8 billion in Q2 2024 and grew by 28.3% YoY from US$10.1 billion in Q3 2023.
BRCs with fixed maturity captured a 9.3% market share. This reflects a slight decline from 9.5% in Q2 2024 but a drop from 19.3% in Q3 2023. Sales fell 2.8% QoQ from US$2 billion in Q2 2024 and declined 50.6% YoY from US$3.9 billion in Q3 2023, highlighting a sharp annual decrease.
Capital protection with knock-out (Sharkfin notes) accounted for 3.4% of the market, down from 9.5% in Q2 2024 and 3.4% in Q3 2023. Sales plummeted by 74.1% QoQ from US$2.7 billion in Q2 2024 and marginally increased by 1.7% YoY from US$689m in Q3 2023.
Callable BRCs posted estimated sales of US$1.7 billion in Q3 2024, holding an 8.3% market share. This was an increase from 5.8% in Q2 2024 and 3.7% in Q3 2023. Sales grew by 3.4% QoQ and 131.7% YoY.
Callable reverse convertibles (RCs) represented a 2.1% market share, down from 1.7% in Q2 2024 and 0.3% in Q3 2023. Sales decreased by 11.5% QoQ but surged by 630.5% YoY.
Dual currency products held a 5.2% market share, down from 6.7% in Q2 2024 but up from 3.8% in Q3 2023. Sales decreased 3.8% QoQ but grew by 42.2% YoY.
Products offering participation in the performance of the underlying and capital protected in terms of minimum capital return eat or above 90% accounted for a mere 0.6% of the market, down from 3.6% in Q2 2024 and 2.4% in Q3 2023. Sales declined sharply by 88% QoQ and by 74.0% YoY.
CLNs secured a 0.7% market share, down from 1.5% in Q2 2024 and 3.5% in Q3 2023. Sales dropped by 64.8% QoQ and plummeted by 78% YoY.
Below we look separately at the use of capital protection and capital-at-risk payoffs in Q3 2024.
Capital Protection
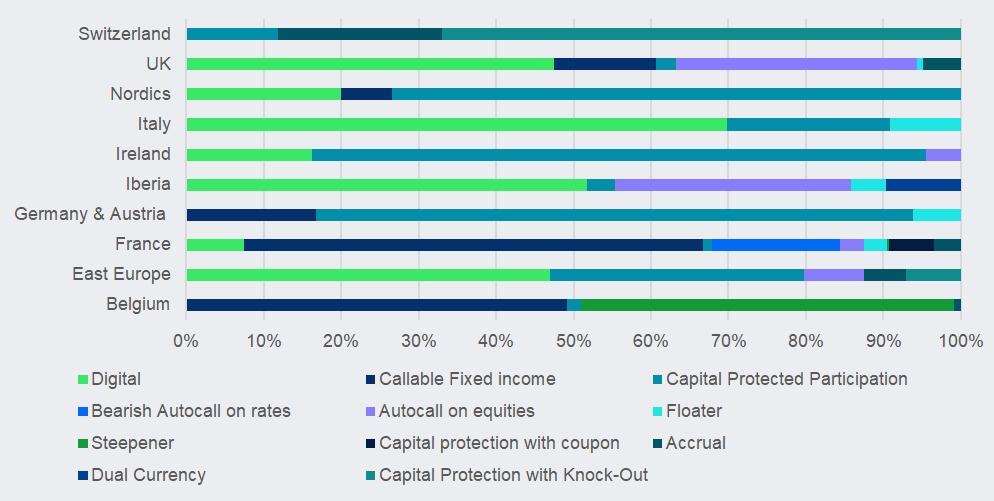
From an offer market perspective, the chart below reflects regional preferences for the various capital protected payoffs.
Europe: capital protection payoffs map – market share by sales volume
Source: SRP
Belgium is dominated by callable fixed income (49%) and steepeners (48%), with minimal representation of other products.
Eastern Europe has a strong preference for digital payoffs (46%) and capital protected participation (32%), with smaller shares in protected autocalls (8%) and capital protection with knock-out (7%).
France focuses heavily on callable fixed income (59%), bearish autocalls on rates (17%) and smaller shares in capital protection with coupon (6%) and accrual (3%).
Austria and Germany are more biased towards products offering participation and protection (77%), with lesser interest in floaters (6%).
The Iberia region shows strong interest in digital payoffs (52%), protected autocalls (30%) and a small share in dual currency deposits (10%). Ireland is heavily skewed towards capital protected participation (75%) and a minor presence of digital products (15%) and protected twin-win participation (5%).
Digital payoffs (69%) and capital protected participation (21%) lead in Italy, with floaters (9%) also contributing.
The Nordics region is dominated by products offering participation and protection (73%) with some share of digital products (20%). Investors in the UK favour digital products (48%) and protected autocalls (31%), with a small share of accrual (5.0%). Lastly, Switzerland heavily focuses on capital protection with knock-out (67%) and accrual (21%) as well as capital protected participation (12%).
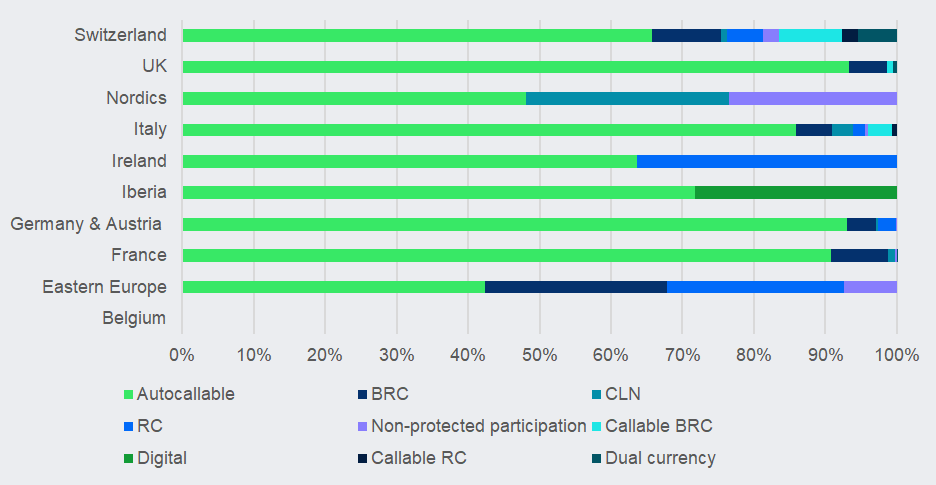
Capital-at-risk
The capital-at-risk segment across European markets reflects a clear preference for autocallable products, which dominate in France (91%), Germany & Austria (93%) and the UK (93%), with a more moderate uptake in Ireland (64%) and Switzerland (66%).
Europe: yield enhancement payoffs map – market share by sales volume
Source: SRP
Barrier reverse convertibles (BRCs) with a fixed maturity hold significant shares in Eastern Europe (25%) and Switzerland (10%) but are minimal elsewhere. Similarly, reverse convertibles (RCs) with fixed maturity show relevance in Eastern Europe (25%), Iberia (36%) and Switzerland (5%), while having a negligible impact in other markets. Callable BRCs have their highest presence in Switzerland (9%).
CLNs are concentrated in Italy (28%) and are largely absent in other regions.
Products that offer participation in the underlying’s performance beyond the capital protected category are mainly notable in the Nordics (23%) and Switzerland (2%). Digital products are relevant in Iberia (28%).
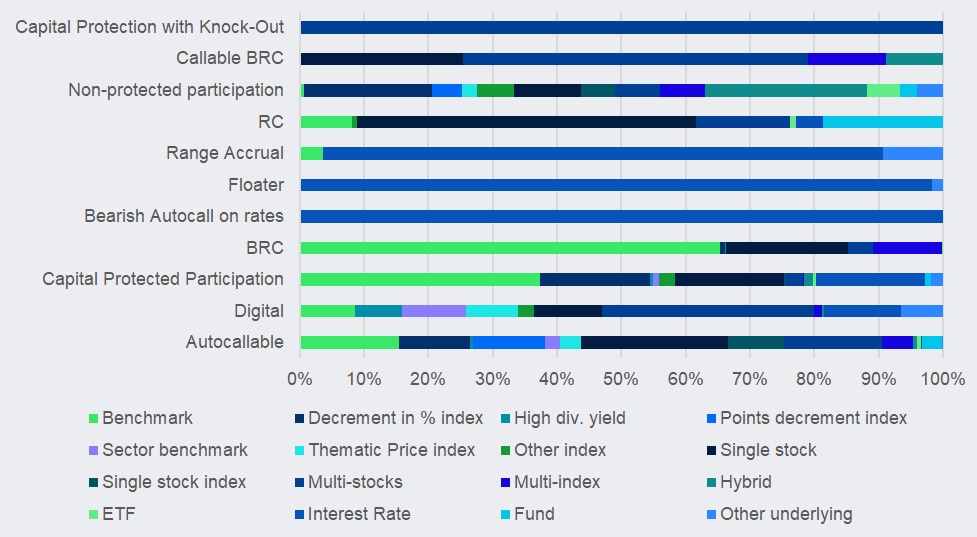
The chart below provides information about the underlying type choices made for each of the main payoffs. Given the bias of multi-stock worst of baskets in Switzerland, and the dominant size of this market in Europe, we have excluded Switzerland from the below analysis to better show other underlying trends.
Europe (ex-Switzerland): payoffs and underlyings – market share by sales volume
Source: SRP
The chart shows the distribution of underlyings across some of the main payoffs.
In terms of used underlyings, autocallables are moderately diversified, with significant bias towards single stocks (23%), decrement indices (11%) and multi-stocks (15%), making them versatile for various underlyings.
BRCs are dominated by benchmarks (65%) and show a strong focus towards single stocks (19%).
An important share (37%) of participation products with capital protection are linked to benchmarks and single stocks (17%) while non-protected participation products span various types of underlyings. Callable BRCs and capital protection with knock-outs are mostly linked to multi-stocks baskets.
Main image: Paopano/Adobe Stock
Do you have a confidential story, tip or comment you’d like to share? Contact Us | SRP (structuredretailproducts.com)
Disclaimer: While SRP's aim is to provide accurate and up-to-date information, the data provided is gathered from third parties. SRP does not take responsibility for the accuracy of the data and will not be held liable for any errors or omissions contained in the information provided. The information and data included on SRP's market reports uses sources believed to be reliable. SRP assumes no liability or responsibility for the quality, content, accuracy or completeness of the information, text, graphics, links and any other items contained on this report.