
Dynamics for European sales volumes and product issuance in 2024 showed a strong start followed by moderated performance later in the year.
The market achieved robust growth in Q1 2024, with sales volumes rising to US$74.8 billion, reflecting a significant improvement compared to US$50.1 billion in Q4 2023. This quarter-on-quarter (QoQ) increase of approximately 49% highlights a strong beginning to the year.
Similarly, the number of products surged to 87,248, up from 59,802 in Q4 2023, showing increased activity in issuance.
In Q3 2024, the market experienced a noticeable slowdown. Sales volumes decreased to US$50.8 billion, a 32% drop compared to Q1 2024, while the number of products declined by approximately eight percent, from 86,287 in Q2 to 79,596 in Q3. Despite this contraction, the year-to-date performance for 2024 remains stronger than the average levels seen in 2023, reflecting a growth-oriented trajectory overall.
Some 253,163 products have struck during the first three quarters of 2024 up from 206,969 products launched in the same period last year.
In terms of sales volumes, the market size increased significantly from an estimated US$156.4 billion striking in the first three quarters 2023 to an estimated US$189 billion in 2024, reflecting a year-on-year (YoY) growth of approximately 21%.
Europe: issuance and sales volumes
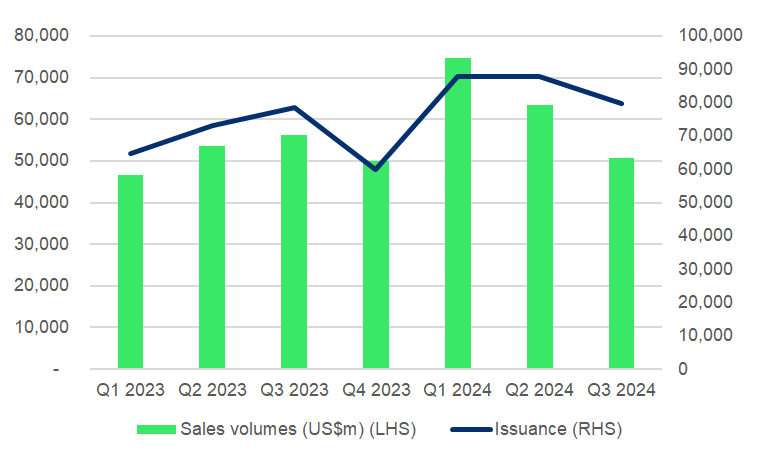
Source: SRP
Sales volumes for the Q3 2024 reveal significant differences across the European offer jurisdictions compared to the Q3 2023 (the green bar).
Europe Q3 2024: YoY and QoQ sales growth*
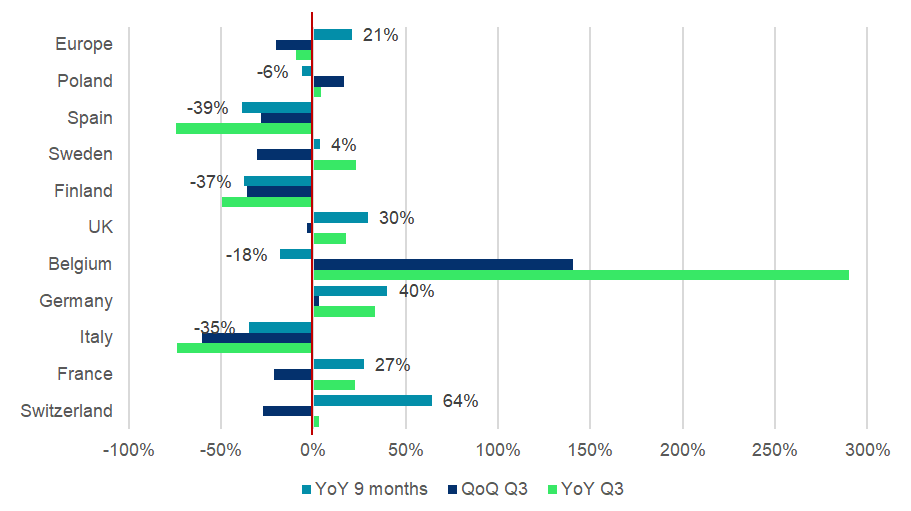
*Percentage sales growth applies to the nine month period between Jan 2024 and Sep 2024
Source: SRP
Germany and France delivered strong performances, with YoY increases of 33% and 22%, respectively, showing the resilience and stability of these markets. The UK also recorded 18% YoY growth. In contrast, markets like Italy (-74%) and Spain (-74%) faced contractions. Finland (-49%) also recorded a decline, signaling weak demand in Nordic regions. Meanwhile, Poland and Switzerland demonstrated modest gains at four percent and three percent YoY, respectively, maintaining relative stability.
When integrating these insights with the nine-month period between January and September 2024, the data highlights Switzerland (+64%), Germany (+40%) and the UK (+30%) leading the way in YoY growth.
France (+27%) and Belgium (-18%) presented mixed trends, while Nordic and Southern European markets like Finland (-37%), Spain (-39%) and Italy (-35%) struggled with notable declines; Poland (-6.0%) remained relatively stable
Overall, Europe recorded a +21% YoY growth for the nine-month period, indicating that the strong performances of certain key markets offset the weaknesses elsewhere.
Europe: sales by market (US$m)
| Market | Q1 2023 | Q2 2023 | Q3 2023 | Q4 2023 | Q1 2024 | Q2 2024 | Q3 2024 |
| Switzerland | 12,139 | 15,092 | 20,034 | 16,546 | 28,357 | 28,491 | 20,680 |
| France | 13,659 | 15,857 | 10,398 | 14,194 | 21,869 | 16,212 | 12,737 |
| Italy | 10,569 | 11,369 | 12,350 | 9,228 | 11,038 | 8,094 | 3,219 |
| Germany | 4,190 | 4,014 | 4,311 | 3,965 | 6,187 | 5,577 | 5,754 |
| Belgium | 1,905 | 1,118 | 309 | 1,333 | 1,026 | 502 | 1,206 |
| UK | 424 | 515 | 561 | 559 | 599 | 683 | 661 |
| Finland | 750 | 547 | 536 | 540 | 454 | 423 | 271 |
| Sweden | 235 | 185 | 111 | 168 | 218 | 196 | 137 |
| Spain | 473 | 2,641 | 4,899 | 2,332 | 1,857 | 1,776 | 1,272 |
| Poland | 350 | 347 | 326 | 290 | 329 | 291 | 341 |
| Europe | 46,556 | 53,664 | 56,195 | 50,055 | 74,766 | 63,438 | 50,803 |
Source: SRP
The chart below illustrates the evolution of the main underlying asset classes.
Europe: asset classes – market share by sales volume
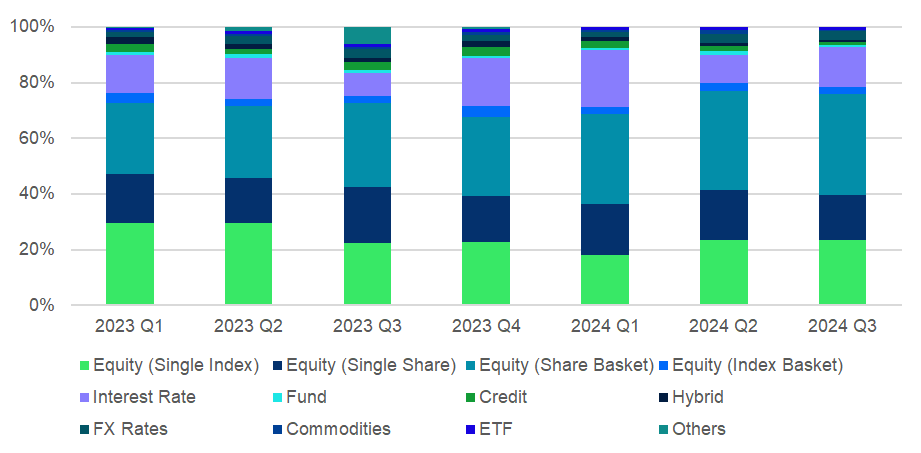
Source: SRP
The equity share baskets category achieved significant growth, increasing its market share from 30% in Q3 2023 to 36% in Q3 2024. This reflects YoY sales growth of six percent and a 51% sales increase over the nine-month period, mostly driven by the Swiss market. Similarly, the products linked to interest rates saw a six percent YoY gain in market share in Q3 2024, alongside impressive 48% YoY sales growth and 49% growth over the nine-month period between January and September.
On the flip side, products linked to single equity stocks experienced a decline, with its market share dropping from 20% in Q3 2023 to 16% in Q3 2024, alongside a significant YoY sales contraction of 28%.
Products linked to single equity indices reversed their downward trend in market share in Q2 2024. After experiencing a steady decline from 29% in Q1 2023 to 22% in Q3 2023, their market share rebounded to 24% in Q2 2024 and stabilised at 23% in Q3 2024. This shift marked the end of its previous downward trajectory. However, they still faced a YoY sales decline of seven percent during the quarter and a marginal five percent contraction over the nine-month period.
Products linked to credit default swaps shrank in both market share (-2.0% YoY) and sales (-76% YoY and -15% over the nine months), marking it as one of the weakest performers. Products linked to a combination of two asset classes (hybrid) also struggled, maintaining a low market share of one percent throughout 2024 YTD and facing a 21% decline in sales over the nine months elapsed.
The below map shows the regional variations in the usage of asset classes in Q3 2024. Key takeaway is that investors in Switzerland are favouring equity share worst-of baskets; investors in France*, Germany and UK are focusing on equity index-linked products; and those in Belgium are showing almost exclusive adoption of interest rate-linked products.
Europe Q3 2024: asset classes – market map*
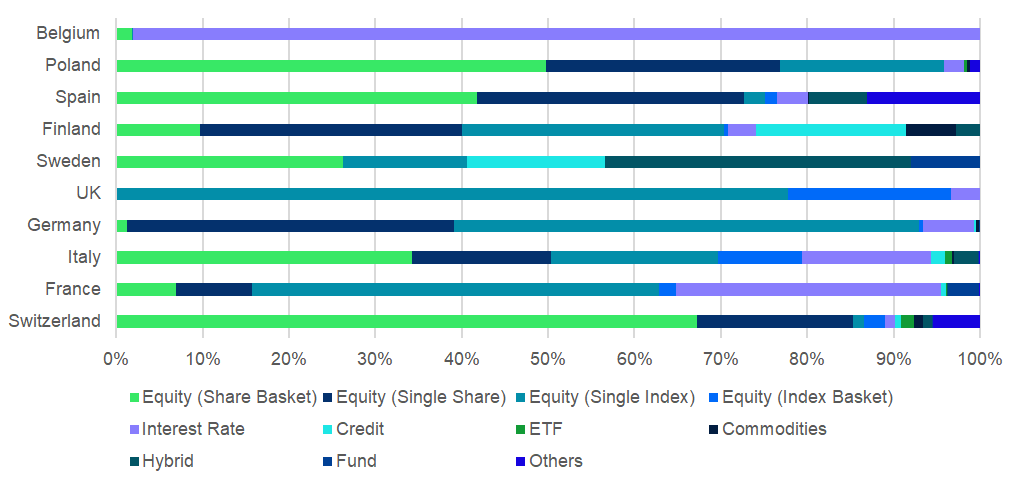
*Per SRP categorisation, single stocks with a decrement, wrapped as an index, are counted within the Equity (single index) category.
Source: SRP
Looking deeper into the underlying landscape, we observe that products linked to multi-stocks ‘equity (share basket)’ have a very important market share in Switzerland (67%), followed by Poland (50%) and Spain (42%).
Single stocks-linked products hold the largest share in Germany (38%), followed by Finland, Spain, and Poland, where the preference for individual stock investments is strong.
Equity (single index) dominates in Germany (54%) and France (47%), signifying the importance of index-linked products in these markets.
Interest rate-linked products are particularly popular in Belgium (98%), far exceeding any other region. France (31%) and Italy (15%) also show an appetite for these products, with French providers also seeking to take advantage of falling rates through bearish autocalls linked to the evolution of the 10-year constant maturity swap rate (CMS) and more recently of the 10-year constant maturity yield (CNO-TEC 10).
Hybrid products have a notable presence in Sweden (35%), while credit-linked notes (CLNs) gain traction in Finland (17%) and Sweden (16%). Commodities appear only in Finland (6.0%).
The analysis shows that equity-linked products continue to play a critical role in most European markets, particularly in Germany, Poland, and Switzerland, while Belgium is a clear exception with a focus on non-equity products.
Germany (with 93%) and Poland (96%) show the highest equity market shares, driven by a balanced mix of single-share and single-index equity investments.
Switzerland (88%) and Italy (79%) also have significant equity representation, with share baskets playing a key role.
France (65%), Spain (76%), and Finland (43%) show substantial equity involvement but include significant shares of other asset classes such as interest rates or credit default swaps.
Given the fact that 97% of the single equity index-linked products in Switzerland are linked to classic benchmarks, in the below table we are looking at Europe ex-Switzerland to better represent the ongoing trends in the various types of indexes.
Even excluding Switzerland, the chart below highlights the continued dominance of traditional benchmark indexes, alongside the rebound of decrement indices and single-stock with a decrement, wrapped as an index. Meanwhile, dividend-focused and risk control strategies see limited uptake.
In part 2 of this analysis we will review the usage of indices and stocks per countries and the various thematics.
Europe ex-Switzerland: single index-linked products – market share by sales volume
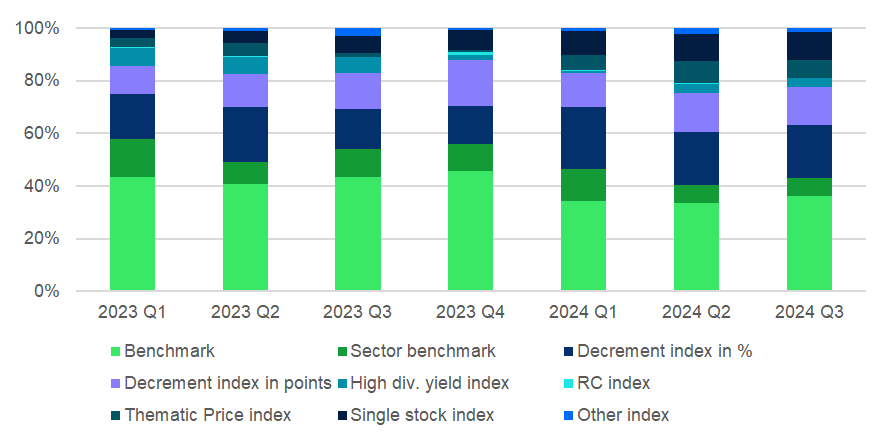
Source: SRP
Benchmark indices remain the most significant contributor to market activity, with market shares fluctuating between nine percent (Q1 2024) and 16% (Q1 and Q2 2023). After a decline in early 2024, market share rebounded to 14% in Q3 2024, showing continued reliance on standard benchmarks.
Both decrement indices deducting the dividend in percentage and points show significant growth in market share since the first quarter of 2023. The market share of decrement indices in percentage terms grew from six percent in Q1 2023 to eight percent in Q3 2024, and the share in points stabilized at six percent after a dip in early 2024.
Single stock decrement indices and thematic price indices have gained traction. Single stock indices doubled their share from two percent in Q3 2023 to four percent in Q3 2024. Similarly, thematic price indices rose from near zero in late 2023 to three percent in Q2 and Q3 2024.
Sector benchmarks have consistently retained a small three percent share, showing little fluctuation or growth.
Image: Gina Sanders/Adobe Stock
Do you have a confidential story, tip or comment you’d like to share? Contact Us | SRP (structuredretailproducts.com)
Disclaimer: While SRP's aim is to provide accurate and up-to-date information, the data provided is gathered from third parties. SRP does not take responsibility for the accuracy of the data and will not be held liable for any errors or omissions contained in the information provided. The information and data included on SRP's market reports uses sources believed to be reliable. SRP assumes no liability or responsibility for the quality, content, accuracy or completeness of the information, text, graphics, links and any other items contained on this report.