Structured products linked to single stock indices and interest rates have registered the biggest growth in the French market.
Fluctuation in the bond and equity markets based on the expectation of falling rates at the beginning of 2024 have put full capital guaranteed products in France in a less favourable context.
The decrease in interest rates (the five-year rate fell from 3.5% at the end of September 2023 to 2.50% at the beginning of January 2024) has caused a slight pullback from 100% capital guaranteed products, with the market once again slowly turning to products putting capital at risk.
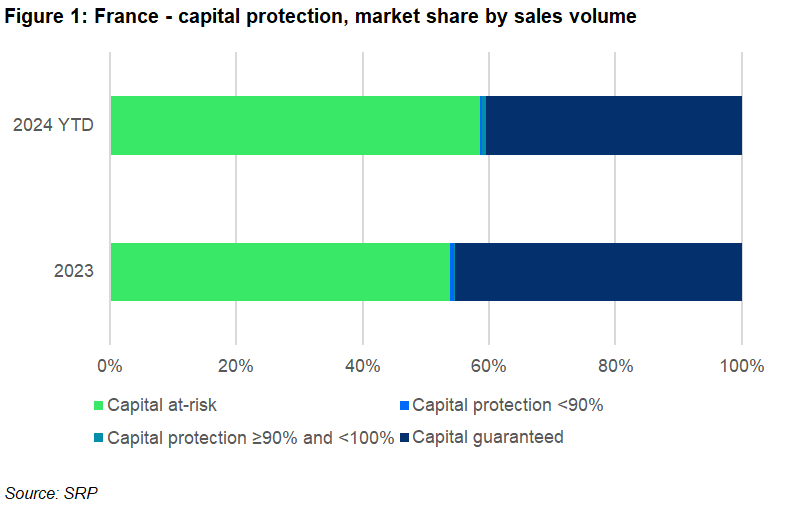
Figure 1 shows a shift in the balance between capital guarantee and conditional protection between 2023 and 2024 year-to-date (YTD).
The proportion of capital allocated to risky products has increased from 54% in 2023 to 59% in 2024 YTD, suggesting that the market has adapted by turning again towards products offering a return in exchange of higher risk. Conversely, the allocation to capital guaranteed products has decreased from 45% in 2023 to 40% in 2024 YTD.
More recently, the uncertainty about future rates, and the shift in market anticipation towards ‘higher for longer’, have brought back the demand for interest rates-linked products seeking to capture current yield levels over the longer term.
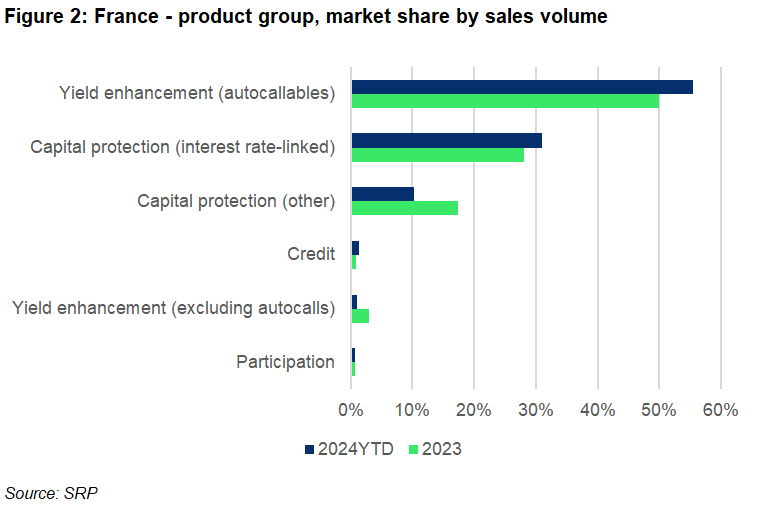
Figure 2 shows that 31% of the notional in 2024 is linked to interest rates while figure 3 gives us a more detailed view of the underlyings asset mix.
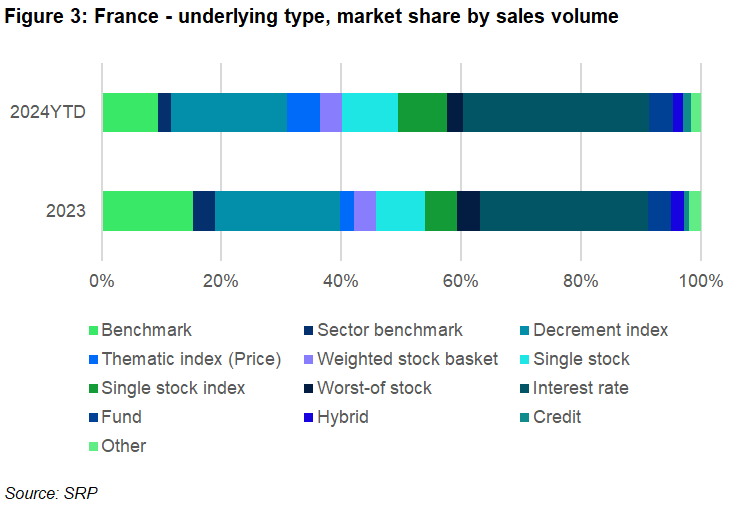
Equity-linked products represents 61% of the offer in the 2024 to date almost flat from 2023, but down 19% compared to the 80% linked to equities recorded in 2022 - in previous years equity-linked products used to represent more than 90% of the product offer.
Interestingly, when it comes to equity with decrement, we can observe reversal of this falling trend (Figure 4).
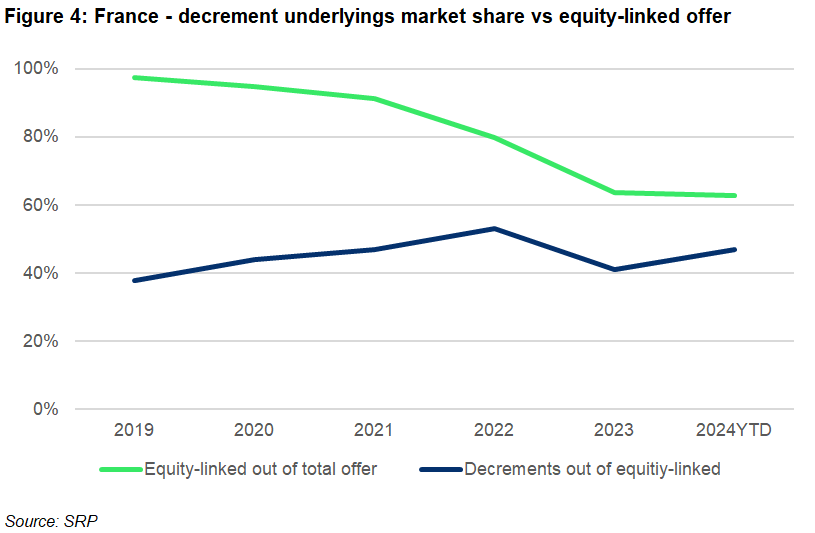
There has been a consistent increase in the market share of decrement underlyings featured in equity-linked products: from 38% in 2019 to 53% in 2022. After falling to 41% in 2023, this percentage has risen again to 47% this year.
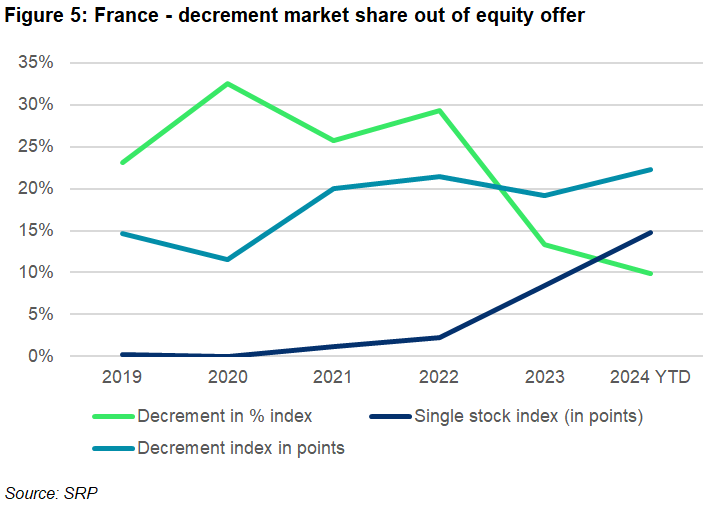
Figure 5 breaks down the decrement underlyings into three main types to show the dynamic shifts in market shares from 2019 to 2024 YTD.
Decrement indices that subtract the fixed dividend in terms of percentage (%) peaked at 32% in 2020 out of the total equity-linked offer. The rise came as a response to the lack of returns and upside offered by the so-called classic indices at that time.
However, the rise was followed by a general decline to 10% market share in 2024 YTD. At the same time, decrement indices in points increased from 12% in 2020 to 22% in 2024 YTD.
Since 2022, single stocks wrapped as an index with a decrement overlay have increased in popularity mostly driven by high stock market levels suggesting investors have been turning to stocks of quality rather than less concentrated indices.
Looking at the quarterly outstanding notional (Figure 6), we observe that single stock indices and interest rates, are the fastest growing underlying assets, adding 196% and 155%, respectively, since January 2023.
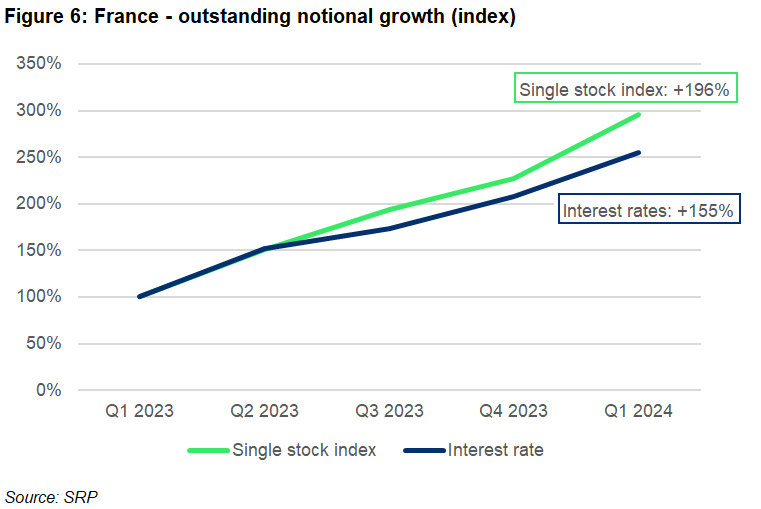
Even with the substantial net inflows, single stock indices represent only three percent of the outstanding notional.
Below (Figure 7), we can see the change in the outstanding notional for the remaining asset classes.
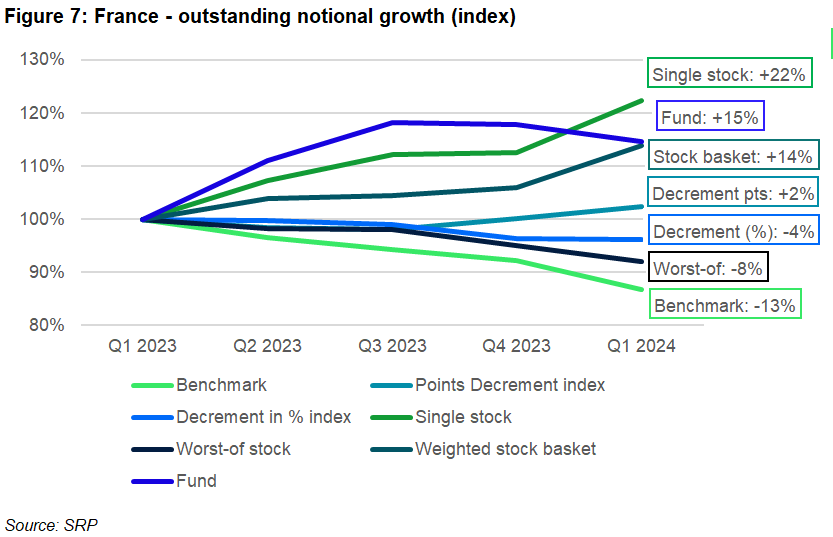
The net inflows for the above underlying types have seen diverse dynamics. Products linked to benchmarks experienced consistent net outflows (new products minus redeemed products in the quarter), indicating a shift away from these indices.
Net inflows of products linked to decrement indices showed diverging trajectories, with decrements in points having positive flows and decrement in % index-linked seeing negative flows. Stocks with decrement and stocks in general mostly displayed strong positive inflows, reflecting increasing demand and confidence in quality stocks.
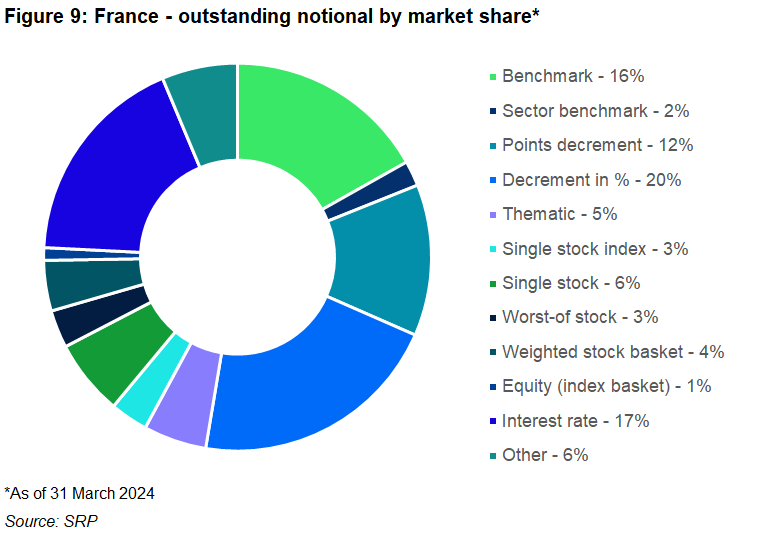
Image: rh2010/Adobe Stock.
Do you have a confidential story, tip or comment you’d like to share? Write to info@structuredretailproducts.com