The next section of the analysis is based on the Fama and French 5-Factor model.
This model represents a regression of an independent variable (the risk-free margin of each reviewed underlying equal to the difference between its natural logarithmic daily return and the prevailing risk-free rate), and the five independent pillars laying the foundations of this model: market risk premium; small versus big premium; high value versus low value premium; robust versus weak premium, and; conservative versus aggressive investment premium.
Fama and French’s updated five-factor model incorporates shifts in the required rate of return, rationale for selection of the underlying for analysis, and the most prominent Fama and French independent variable/premium which influenced required rate of return to the strongest extent (Figure 4).

As a whole, this model predicts the returns of a diversified portfolio with roughly 90% accuracy. The five pillars are based on the notion that value companies (ie equities which trade at considerably lower levels than their industry counterparts, and showcase low price-to-book and price-to-earnings ratios and higher dividend yields) persistently outperform their rivals.
Due to their riskier nature, value stocks tend to offer risk premiums relative to growth stocks for investors. The model also assumes that smaller companies tend to outperform the returns of larger entities due to the higher weighted average cost of capital (WACC): smaller companies have a higher WACC due to their elevated cost of equity, and higher interest expenses on debt built in the cost of the debt component of the WACC.
The market risk premium is indicative of the higher return achieved by any other security (ie stock, index, fund, ETF etc) purchased over a virtually risk-free treasury bond.
In 2014, the model added two additional premises rationalising portfolio performance. Firstly, the concept that companies banking on higher operational profitability perform better on the capital markets, and secondly those companies with a higher capital intensity in large-scale investments are predisposed to diminish stock performance.
The outcome of the econometric regression underlying provided by the Fama and French model is the required rate of return for a certain security – in other words, the greater the risk, the bigger the compensation.
Our analysis is based on a sample of 10 underlyings based on issuance and sales – two of them led sales and issuance in 2019 and 2020 – the Nasdaq 100 and DJ Industrial Average Index. Others have risen rapidly through the rankings of structured product underlyings in terms of sales and issuance (Amazon, Citigroup, and Invesco QQQ Trust Series 1), raised increased sales volumes (Mastercard, Bank of America), appeared in new issuances (Starbucks), as well as laggards in issuance in 2020 compared to 2019 (Netflix). In addition, the sample includes an index representing a moderate to high drop in sales volume (the Citi Dynamic Asset Selector 5 ER Index).
In other words, the selection is based on leading underlyings - the ones displaying the sharpest upward or downward movements through the sales volume and issuance rankings.
Indices
One of the underlying indices which failed to capitalise on markets rallying was the Citi Dynamic Asset Selector 5 ER Index. Despite the positive momentum its closing prices registered in April 2020, its sales were dwarfed by sales in May-June 2019 when its price level was at its peak and were cautiously on the rise.

This volatility control index is exclusively used as an underlying for uncapped call/enhanced tracker structured products, guaranteeing a minimum capital return of at least 100%. The index relies on its dynamic allocation between an equity futures index tracking e-mini S&P 500 futures, and a futures index indicative of 10-year Treasury notes.
The best case scenario materialises if the 63-day momentum trend signals are strong, and volatility has not exceeded 15%, in which case two-thirds of the index are allotted to the equity futures, and one-third to the bond futures. As momentum fades and volatility declines, market regimes gradually shift and up to 100% of the exposure can be shifted to the treasury constituent.
Additionally, if volatility for the preceding 21 business days surpasses five percent, exposure is transferred proportionately to a cash component.
An intrinsic risk for this underlying is its dependency on interest rates, as an increase may trigger a limited return potential of the treasury constituent futures index. Our analysis shows that its required rate of return is the lowest among all reviewed constituents - at 0.04% in May 2020.
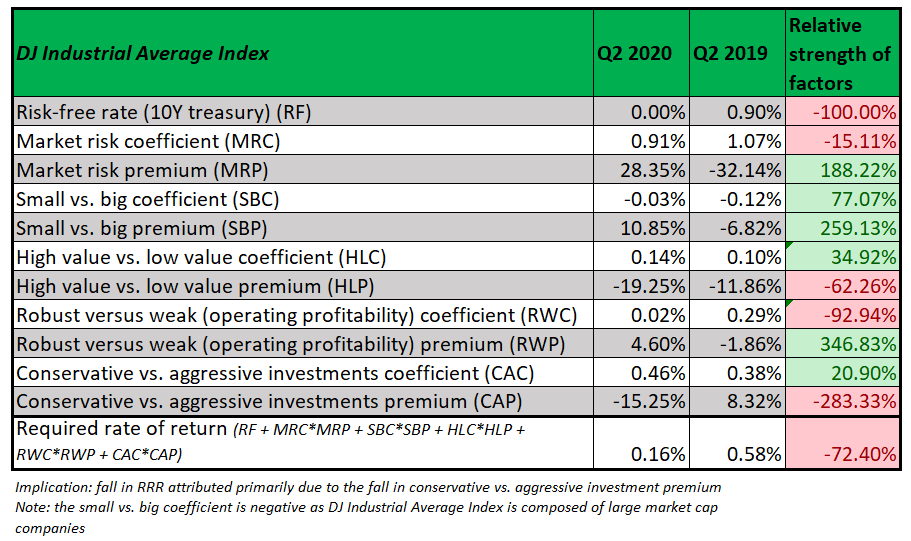
Large-cap indices such as the DJ Industrial Average Index and Nasdaq 100 had their required rate of return diminishing in May 2020 compared to a year ago, most notably the former – which saw a decrease from 0.58% to 0.16%.
Stocks
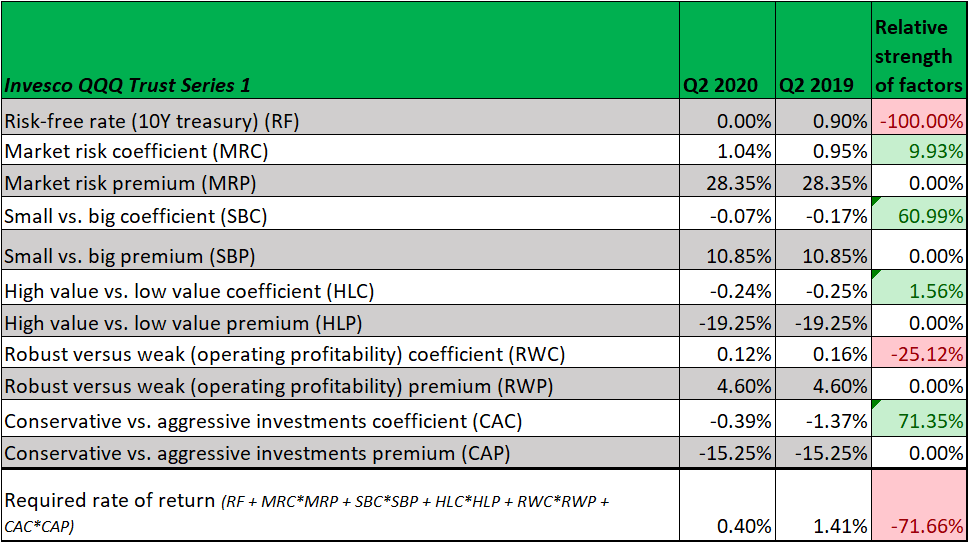
Among the other underlyings analysed, Amazon doubled its required rate of return from 0.36% to 0.77% in spite of its stock hitting historical highs, while the required rate of return for Invesco’s ETF plunged from 1.41% to 0.4%. Despite the limited potential return sales of products linked to this ETF increased from US$0.25 million to US$71.741 million, which represents a 28596% for the reviewed period in 2020 (May 2020-23 June 2020) compared to the equivalent period in the prior year.
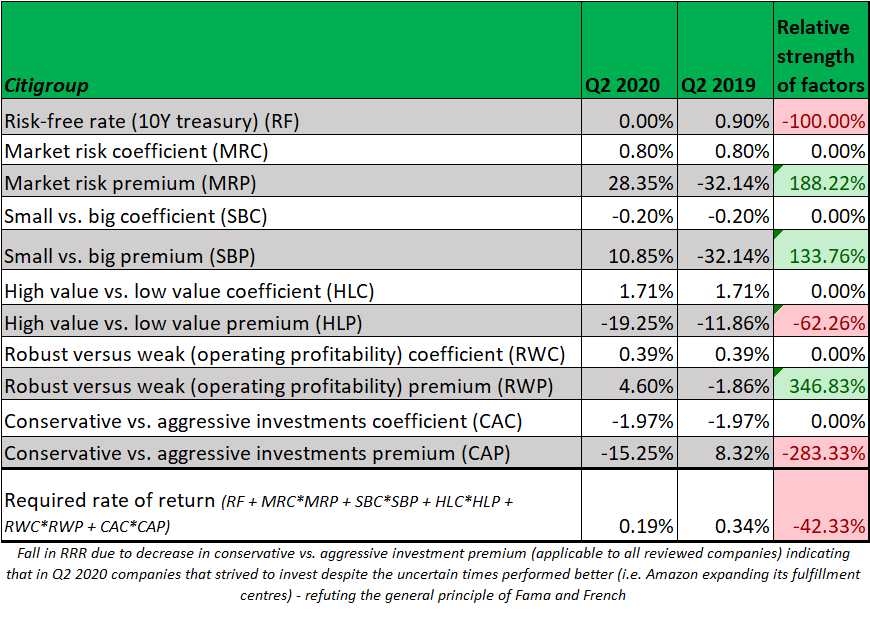
The shares of Bank of America and Citigroup saw their required rate of return dwindle. Although most banks remained robust and profits stood in positive territory, they needed to allocate excessive amounts for their bank loss provisions due to the impact of the Covid-19 pandemic and the increase in bad loans, thus investor enthusiasm may have been dampened.
The analysis shows that Netflix and Mastercard saw their required rate of return falling while digital companies such as Amazon had a higher rate of return.
Overall, the Fama and French model adequately highlights the five underlying factors to determine underlying performance, as judged by the R squared, which serves as an indicator of the degree the five independent Fama and French premiums rationalise excess return, especially in the case of DJ Industrial Average Index, where 98.91% of fluctuations in excess return over the risk-free rate are a direct product of shifts in the five Fama and French factors.

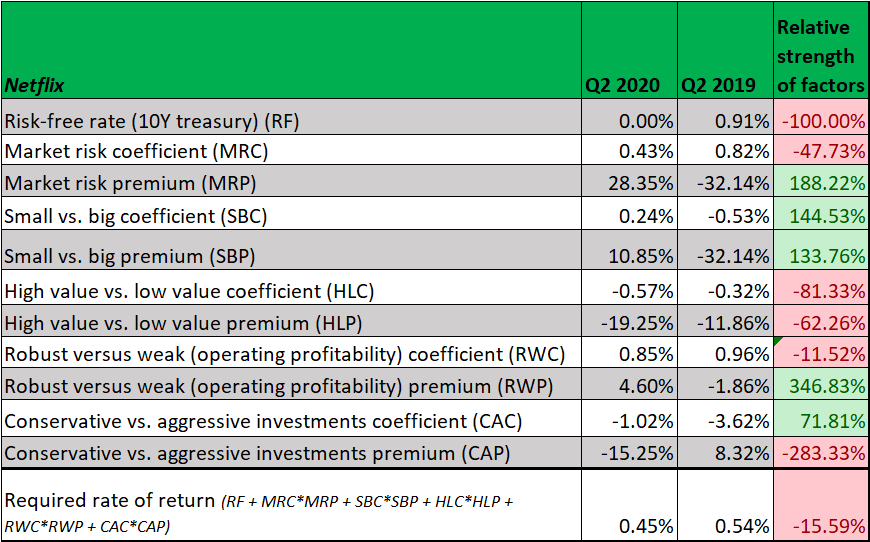
On the other hand, solely Netflix stock has its R squared failing to reach 50%, which questions the veracity of the model in this particular instance.
For six of the reviewed underlying stocks/indices/ETFs, the most substantial influence on returns was the market risk premium. One of them attributes its performance to the conservative v aggressive investment premium (ie Starbucks’ share) whereas investment banks whose stock is notoriously undervalued primarily have their stock movements explained by the premium delivered by high value (ie low P/E ratio, low P/B ratio).
Top to bottom
Our findings revealed that all analysed structured products with the notable exception of Amazon experienced declines in their security required rate of return in May 2020 relative to May 2019.
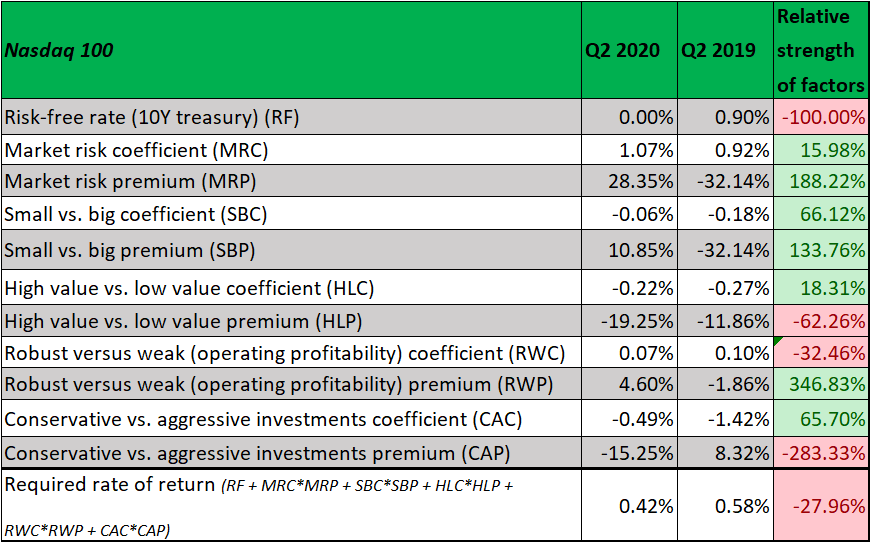
Individually, the common stock of Netflix and Nasdaq 100 had their required rate of return decreasing by the lowest margin (respectively by 15.59% and 27.96%). One of the key cornerstones rationalising the widespread drop in required rate of return/discount rate was the shrinking 10-year treasury yield, which roughly stood at zero percent in May 2020, while a year prior it was at 0.90%.
The fall in required rate of return for DJ Industrial Average Index was primarily attributed to the fall in conservative v aggressive investment premium, and its negative small v big coefficient as the DJ Industrial Average Index is composed of large market cap companies.
The reason behind the fall in required rate of return for the Nasdaq 100 was its shrinking conservative v aggressive investment premium in a similar vein to the DJ Industrial Average Index. It is worth noting that the Nasdaq 100 high v low value coefficient has a negative value – the Nasdaq 100's major constituents such as Apple, Microsot, Amazon, Facebook, Alphabet, and Tesla are predominantly growth companies having a high P/E ratio.
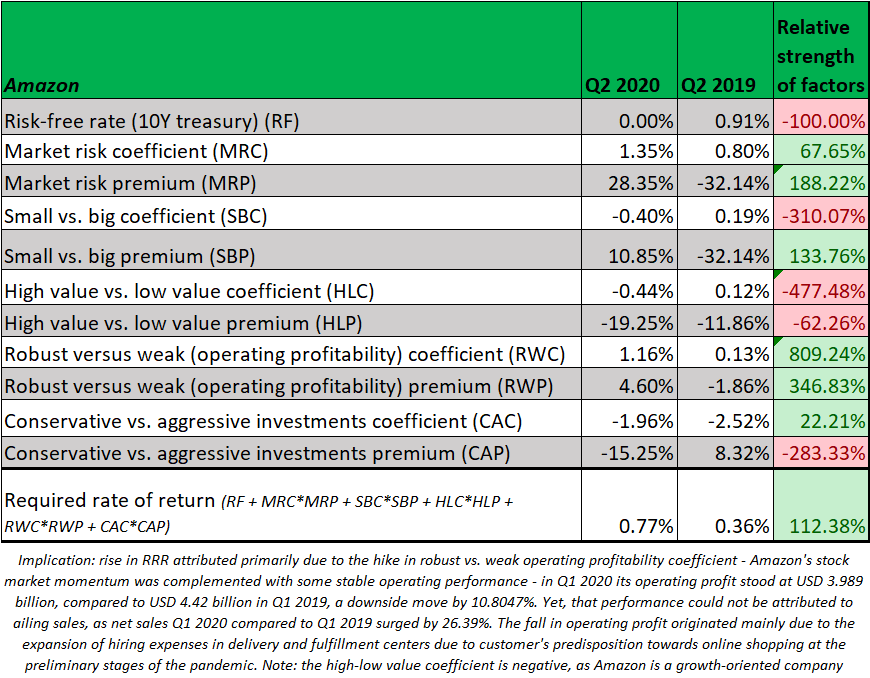
Conversely, the rise in the required rate of return for Amazon was caused by its hike in robust v weak operating profitability coefficient - Amazon's stock market momentum was complemented with a stable operating performance. In Q1 2020, its operating profit stood at US$3.9 billion compared to US$4.42 billion in Q1 2019, a decrease of 10.8%. Yet, that performance could not be attributed to ailing sales, as net sales Q1 2020 compared to Q1 2019 surged by 26.39%.
The fall in operating profit was mainly due to the expansion of hiring expenses in delivery and fulfillment centers due to customers’ turning to online shopping at the preliminary stages of the pandemic. Similar to the Nasdaq 100, Amazon’s high-low value coefficient is negative since it is a growth-oriented company.
Declines in the required rate of return recorded by Bank of America and Citigroup were both triggered by the decrease in conservative v aggressive investment premium (applicable to all reviewed companies) indicating that in Q2 2020 companies that strived to invest despite the uncertain times performed better on the stock market (ie Amazon expanding its fulfillment centres) - refuting the general principle of Fama and French.
On the other hand, Netflix proved otherwise – its greater spending on technology and development affected its stock adversely in the short-run when expenses were incurred but turned out to be beneficial only a quarter later. The technology and services provider's conservative v aggressive investment coefficient marked an increase which is evident from its Q1 2020 income statements - its technology and development expenses rose from US$383 million in Q1 2019 to US$454 million in Q1 2020.

As stipulated by Fama and French, increase in investments may impact adversely performance on the stock market at least until the company manages to monetise its technological breakthroughs.
In Q1 2019, from 4 January 2019 to 29 March, 2019 Netlix's closing price soared by 19.82%, whereas in Q1 2020 growth was more modest (+9.58%). That's why the conservative v aggressive investment coefficient marginally increased despite remaining in negative territory - as Netflix invested more intensely in Q1 2020 compared to the quarter a year ago, its stock performance was more subdued.
Yet, the coefficient is still negative since Netflix is a fundamentally digital company, where innovation is at the center of the organisational structure. Conversely, in Q2 2020 Netflix's stock price leaped by 24.98%, which backs up the theory that R&D expenses do not hone operational profitability instantaneously but protractedly.

Some insight on the ramifications of a required rate of return on a downtrend for investors may be provided by the Gordon growth model. This stipulates the maximum price an investor is willing to pay for a security can be obtained by dividing the incumbent dividend payment for a given security by the difference between the required rate of return and its dividend growth rate.
In other words, as most reviewed underlyings experienced dampened required rates of return, this tendency indicates a greater propensity among investors to elevate the maximum price they are willing to pay to purchase a security, which is hardly sensational news given the relentless rebound of the capital markets since May 2020.