
In this article, we look at the role Gamma to understand how to re-hedge positions in relation to the rate at which Delta changes in relation to the underlying.
The first article in this series examined Delta, which measures the sensitivity of an option or structured product’s price to the underlying asset. Typically, a call option or structured product that is ‘long the underlying’ will have a Delta between zero and one, while a put option or bearish structured product will have a Delta between zero and minus one.
Gamma measures the rate of change of Delta and is therefore known as a second-order Greek, as it is the derivative of a derivative
Gamma measures the rate of change of Delta and is therefore known as a second-order Greek, as it is the derivative of a derivative.
While the most obvious interpretation of Delta is sensitivity of an option to its underlying asset, it also determines the amount of underlying that must be held as a direct or Delta hedge. Gamma is crucial as it shows the rate of change of Delta, which translates into how frequently the Delta hedge will need to be rebalanced as the underlying moves.
Since Delta and Gamma are both derivatives with respect to the underlying spot price, they have a closely linked relationship.
It can be shown that the holding an amount of stock equal to the Delta gives an instantaneously risk-free position with respect to underlying asset, where the current Delta D(S) is given by:
D(S) = ∂f(S)/∂s
Suppose a trader has sold a call option and bought a quantity of D in the stock.
The overall profit and loss (P&L) position will depend on the premium received, the cost of the initial Delta hedge and previous gains or losses since the position started.
However, the only assets that are exposed to the underlying at the current time are the option and the stock position. From the trader’s perspective, the total value of these holdings is:
D * S – f(S)
where f(S) is the current option price.
If the stock then changes by a small amount h, moving from S to S+h, the new portfolio value is now:
D * (S+h) – f(S+h)
Which approximates to:
D * (S + h) – (f(S) + h D)
Simplifying we see that this expression equals:
D * S – f(S)
This is the original value before the stock move, with the “h” terms cancelling out. Importantly, it does not depend on whether h is positive or negative, or its magnitude provided the first-order approximation remains accurate.
The fact that the combined value of these two holdings remains constant provides heuristic proof that the Delta hedge protects against market movements. The precise theory around how the price function and Delta expression are derived is more subtle and relies on a duality in that neither can exist without the other.
Gamma becomes particularly important when the stock price moves significantly from the current level, as it determines the rate at which Delta changes concerning the underlying.
In the previous article, we examined the price and Delta evolution of a call and put options.
Figure 1: The relationship between Delta and Gamma for a call option
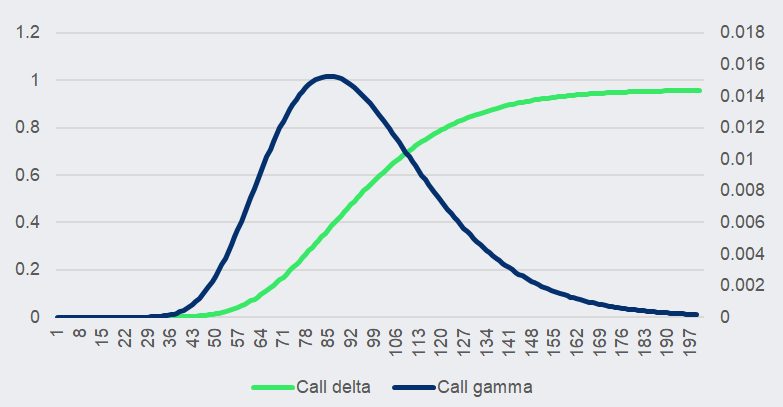
Source: FVC
The chart above shows that while Delta climbs steadily from 0 to 1, Gamma is symmetric and peaks near the strike value.
This is easy to interpret, Delta values of 0 and 1 respectively are at the end of the underlying value axis. Delta changes the most in the middle of the chart, where every small change in spot value will significantly impact Delta. This can be seen in the way the Gamma chart peaks.
Gamma is all about rebalancing, while the spot value is near the strike value, any change away from a Delta of around 0.5 increases will start to make a high probability of payout and therefore full stock exposure more likely, and similarly, it will drop quickly as the spot price declines.
For a trader that has sold an option where the Gamma of the option itself is positive, their position is termed “short Gamma”. This means that if the stock price moves repeatedly within a range, they will need to frequently rebalance their position. This results in losses, not because of transaction costs, but because of the need to “chase” the stock price.
| Spot | Delta | Gamma |
| 100 | 58.74% | 1.30% |
| 101 | 60.03% | 1.28% |
Source: FVC
If the spot price moves from 100 to 101, then another 1.3% of hedge will need to be done by the time it gets to 101. If this is done at a spot value of 101, then it will cost 1.313 units. If the spot price returns to 101, then it will require immediate unwind of that position, potentially back at 100. If the sale is done at this level, the receipt will only be 1.30 units. This shows a small loss, and the product is ending up at the same position.
Part of the option premium received in the first place is effectively a budget for such transactions. However, if the volatility of the stock increases and more of these changes occur, the trader will incur losses unless volatility is hedged elsewhere. This will be explored further in the next article on Vega, the measure of volatility sensitivity.
This effect is more pronounced for shorter maturity, as rebalancing needs to happen in a shorter time.
This can be seen in figure 2 where Gamma values are much higher. They are also slightly shifted because of a modelling effect, where it is not exactly at the strike level but moves closer as the maturity declines.
Figure 2: Gamma values for a call option with two-years remaining versus one month remaining
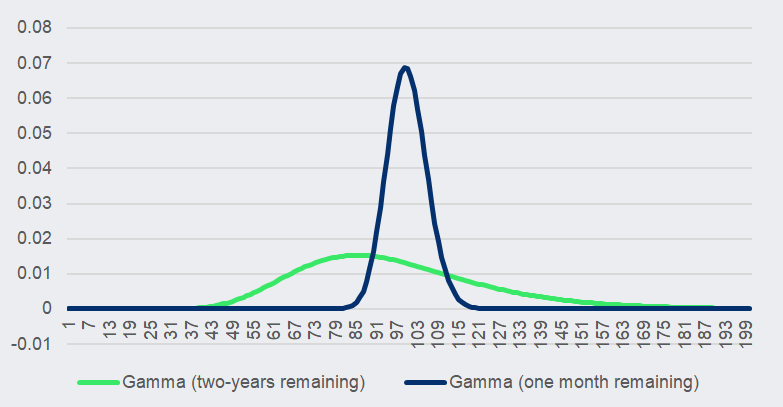
Source: FVC
Options are all about hedging for a trader, and Gamma is the way to navigate this.
Main image: Blob Orange/Adobe Stock.
Discover the power of SRP Greeks and see how our latest data solution enhances trading strategies and risk management with key Greeks calculations - Request a demo today.